Environment Sensors
Location: —
Date/Time:–
![]()
—
![]() Temperature
Temperature
—
![]() Humidity
Humidity
—
![]() Noise Level
Noise Level
—
![]()
—
![]()
—
![]()
—
![]()
—
![]()
—
![]()
—
![]()
—
![]()
—
![]()
—
Good
Satisfactory
Moderate
Poor
Very Poor
Severe
| Category (Range) | PM 10 | PM 2.5 | NO2 | O3 | CO | SO2 | CO2 | AQI | Temperature | Humidity | Noise level | LUX | UV |
|---|---|---|---|---|---|---|---|---|---|---|---|---|---|
| Good | 0-50 | 0-30 | 0-40 | 0-50 | 0-1.0 | 0-40 | 0-700 | 0-50 | 10-40 | 0-50 | 0-40 | 100-1000 | 0-4 |
| Satisfactory | 51-100 | 31-60 | 41-80 | 51-100 | 1.1-2.0 | 41-80 | 701-1000 | 51-100 | 41-50 | 51-80 | 41-80 | 1001-5000 | 4.1-5 |
| Moderate | 101-250 | 61-90 | 81-180 | 101-168 | 2.1-10 | 41-380 | 1001-1500 | 101-200 | 51-60 | 81-90 | 81-90 | 5001-15000 | 5.1-7 |
| Poor | 251-350 | 91-120 | 181-280 | 169-208 | 10–17 | 381-800 | 1501-2500 | 201-300 | 61-70 | 91-100 | 91-110 | 15001-20000 | 7.1-9 |
| Very poor | 351-430 | 121-250 | 281-400 | 209-748 | 17-34 | 801-1600 | 2501-5000 | 301-400 | 71-80 | 101 + | 111-140 | 20001-75000 | 9.1-10 |
| Severe | 431 + | 251 + | 400 + | 749 + | 34 + | 1600 + | 5001 + | 401-500 | 81-100+ | 141-180 | 75001-120,000 | 10+ |
ENVIRONMENT SENSORS
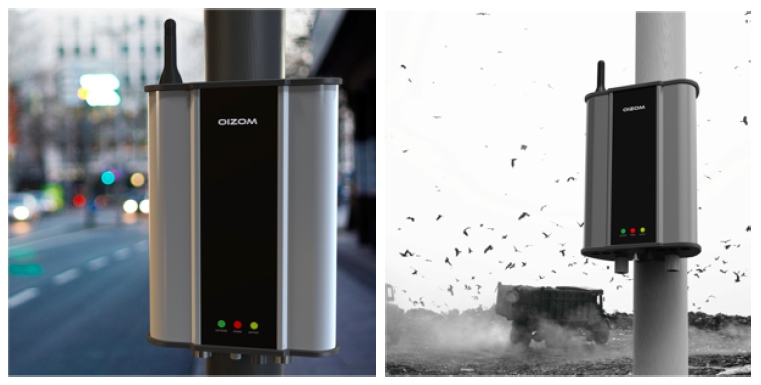
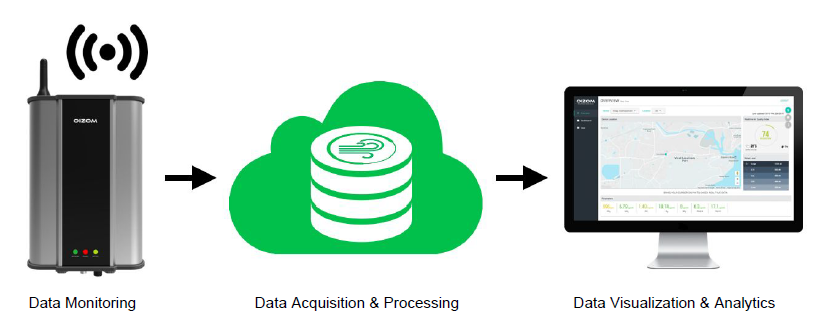
The Environment Sensors are enabled with accurate sensing system to detect and measure various environmental parameters like Particulates, Gases, Noise, Light, Weather etc. Being an IoT solution it delivers real-time data to the central server system using various wired/wireless communication methods.
The City’s IoT based Environmental Sensors are integrated, advanced systems aimed to assume the manifold tasks involved with data and improve the quality of City’s environment. It enhances environmental monitoring capabilities includes the monitoring of the effect of environmental changes for humans, animals and plants. Pollution on the earth changes by augmenting air quality, aridity, humidity, earthquakes, floods, tsunamis, landslides, green space and biodiversity impacts on the environment.
Environmental sensors are installed at 5 locations in Davanagere city:
1.Mandakki Bhatti
2.DC Circle
3.Onion Market
4.Lakshmi Flour Mill
5.KR Market


Large LED Display for viewing Environment Sensor Parameters
Dissemination of real-time status of air quality parameters through City Web portal, Mobile App and LED display. Ability to display data in easy to understand manner using text, color coded graphs/images, etc.

